

Two decades of changes in social cohesion in Latin America (2004-2023)
Juan Carlos Castillo, Julio Iturra, Gabriel Cortés & Tomás Urzúa
Departament of Sociology, Universidad de Chile
Universität Bremen
07th April, 2026
Project context
![]()
- Social Cohesion Observatory (OCS) was a project funded under Center for the Study of Conflict and Social Cohesion (COES 2013-2025)
- Launched in 2020 with the aim of contributing to the analysis of social cohesion in Chile and Latin America
- It is based on experience gained from international projects focused on conceptualizing and measuring social cohesion
- This study: based on data from VISLATAM (N = 179,377, nested within 174 country waves across 25 countries)
What have been the regional and national trends over the past two decades in the area of social cohesion in Latin America?
What are the main factors associated with these changes?
Theoretical and empirical background
- In Latin America, social cohesion has become increasingly important due to the political instability, persistent inequality, and social conflicts that have characterized recent years (Salazar-Xirinachs 2023).
Two main approaches:
- Focus on macro-institutional indicators (UNDP, CEPAL) (United Nations Development Programme 2023).
Combining individual (micro) variables with macro variables (Ecosocial, OCS).
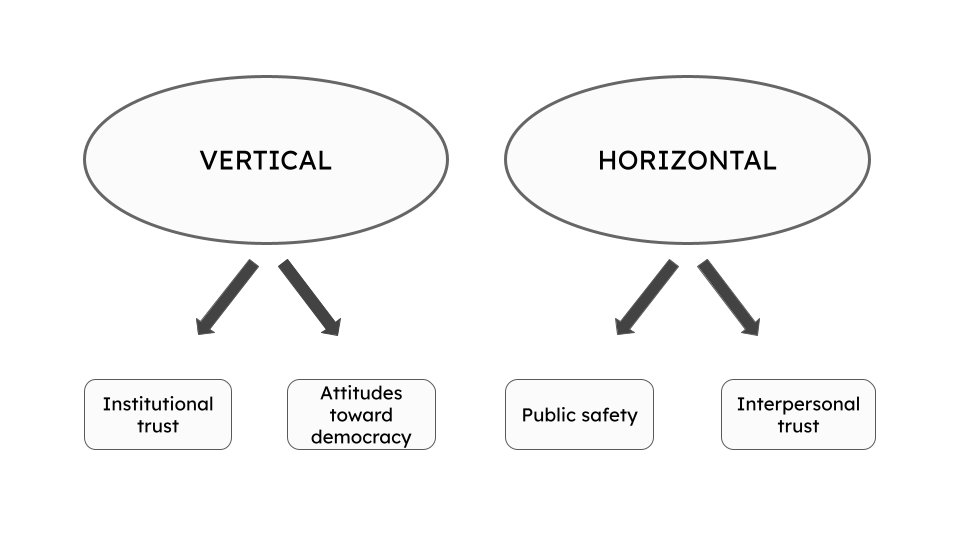
Social cohesion
“is a state of affairs concerning both the vertical and the horizontal interactions among members of society as characterized by a set of attitudes and norms that includes trust, a sense of belonging and the willingness to participate and help, as well as their behavioural manifestations” (Chan et al., 2006, p. 290).
Chan, J., To, H.-P., & Chan, E. (2006). Reconsidering Social Cohesion: Developing a Definition and Analytical Framework for Empirical Research. Social Indicators Research, 75(2), 273–302.
¿How social cohesion has been studied?
- Relevant studies on social cohesion at the international level: Social Cohesion Radar, Ecosocial, VISLATAM.
- These studies have helped to develop various frameworks for social cohesion, enabling comparative studies across countries.
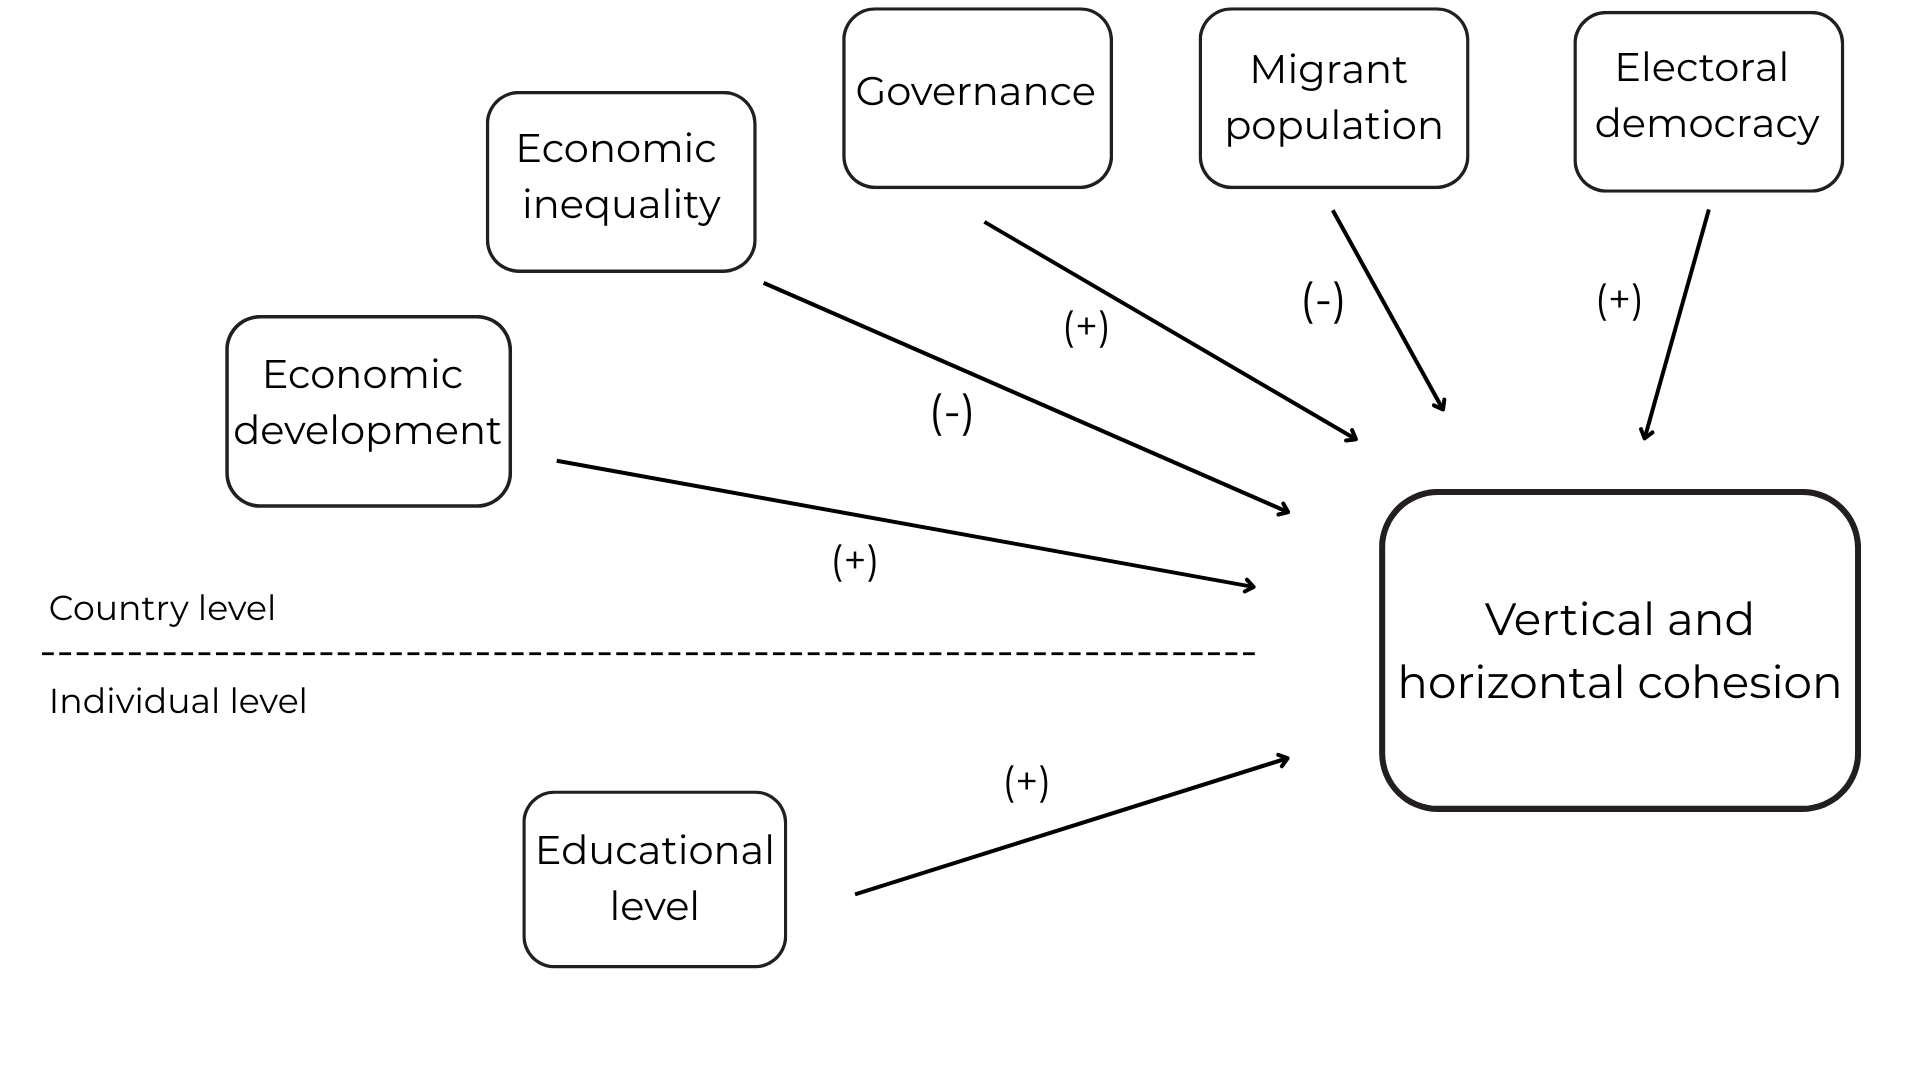
Associated factors
Individual factors:
- Educational level
Macrostructural factors:
- Economic development
- Governance
- Economic inequality
- Migrant population
Hipotheses
Methodology
Data
- The data comes primarily from the survey conducted by the Latin American Public Opinion Project. To supplement this, data from Latinobarómetro and the World Values Survey was used.
- This study includes a sample of N = 179,377 individuals across 174 country waves in 25 countries, covering the period from 2004 to 2023.
Variables
- Dependent variables: vertical cohesion index and horizontal cohesion index.
- Individual independent variables: educational level.
- Contextual independent variables: GDP per capita, Gini Index, Electoral Democracy Index, Governance Index, Cultural diversity.
Method
- To validate the conceptual model that was developed, a confirmatory factor analysis was conducted.
- Hybrid multilevel regression models (Schmidt-Catran y Fairbrother 2016).
- \(y_{jti} = \beta_{0}(t) + \beta_{1}X_{jti} + \gamma_{be}\bar{Z}_{j} + \gamma_{we}(Z_{jt}-\bar{Z}_{j}) + v_j + u_{jt} + e_{jti}\)
Results
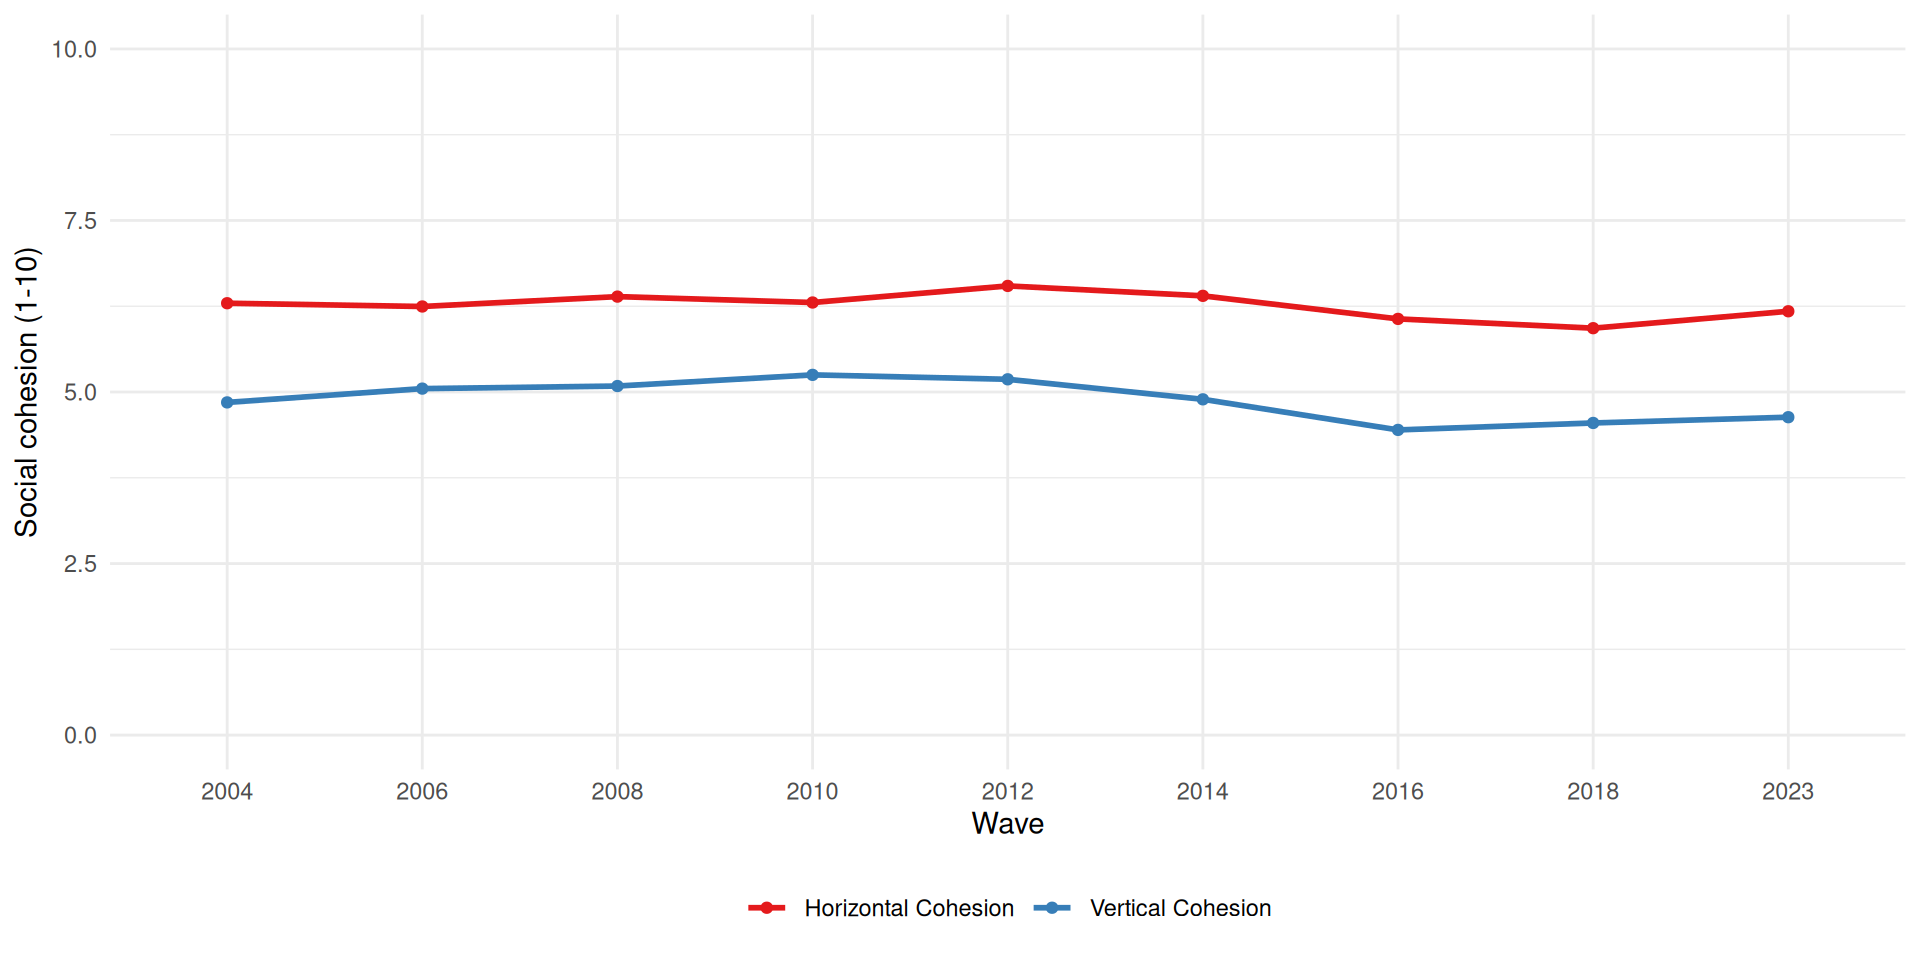
Figura 1: Evolution of vertical and horizontal cohesion (2004-2023)
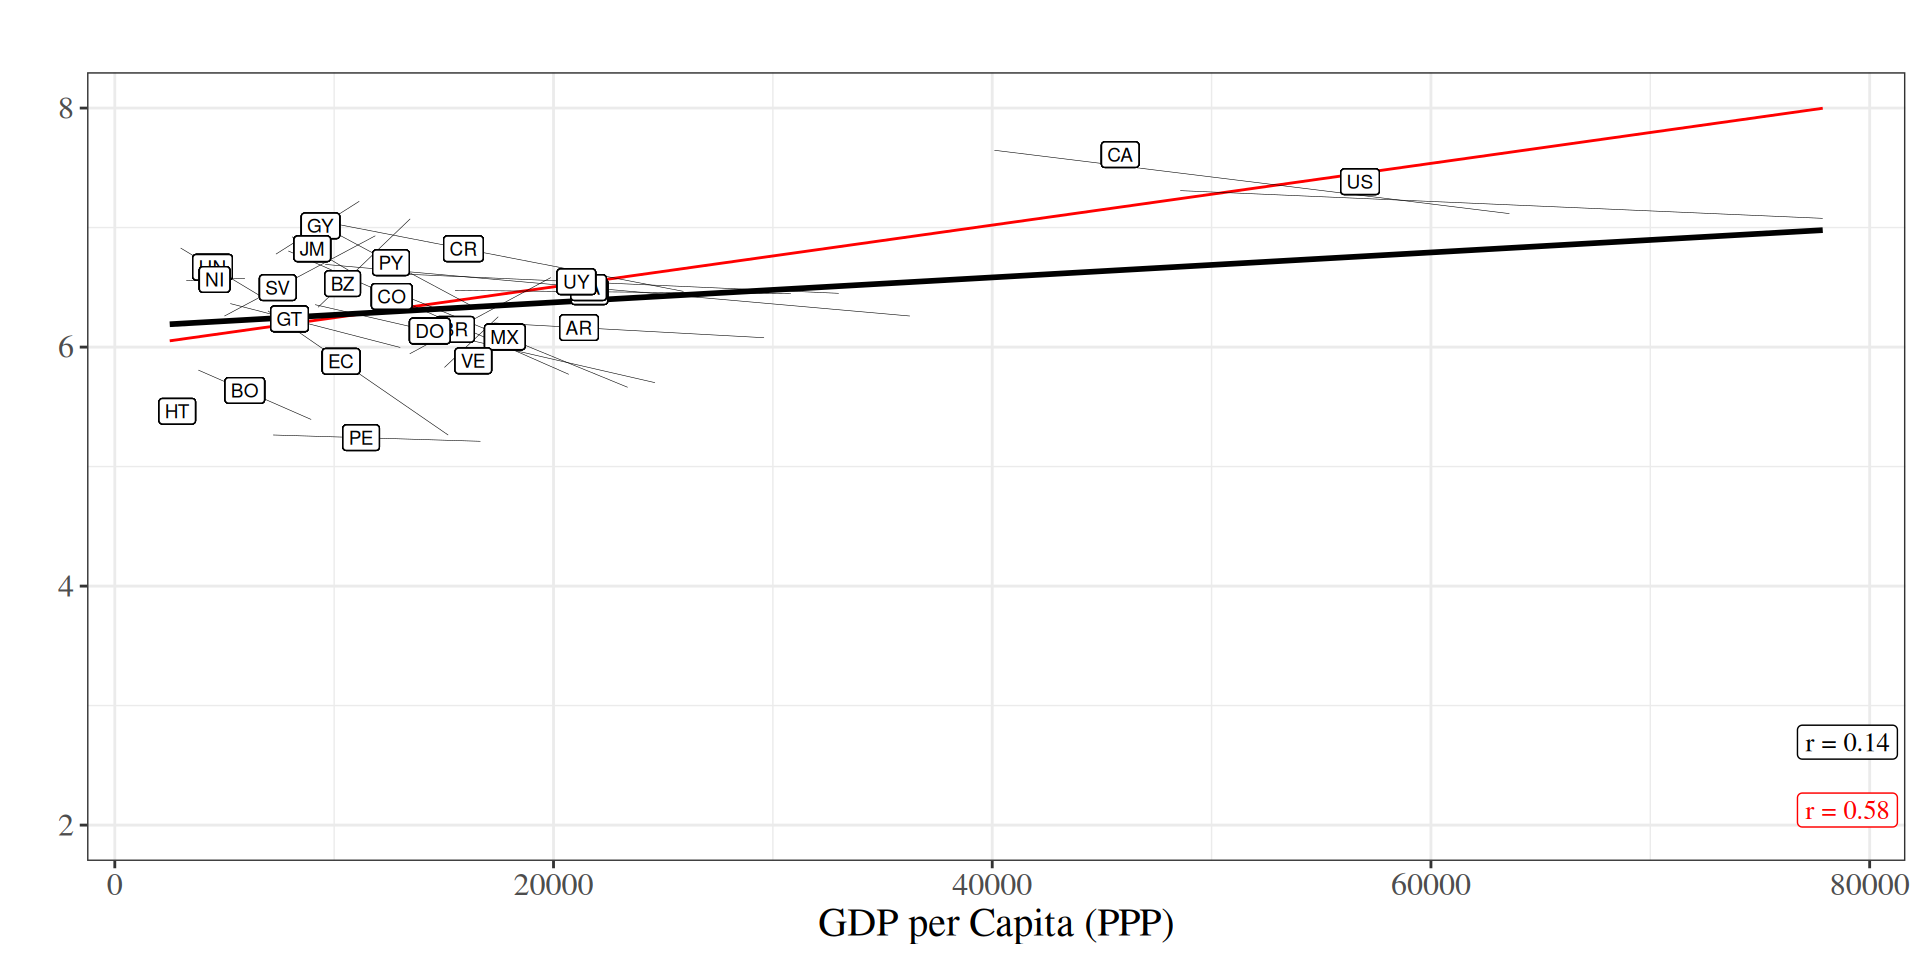
Figura 2: Association between GDP per capita (PPP) and horizontal cohesion. Red line represents the association including Canada and United States.
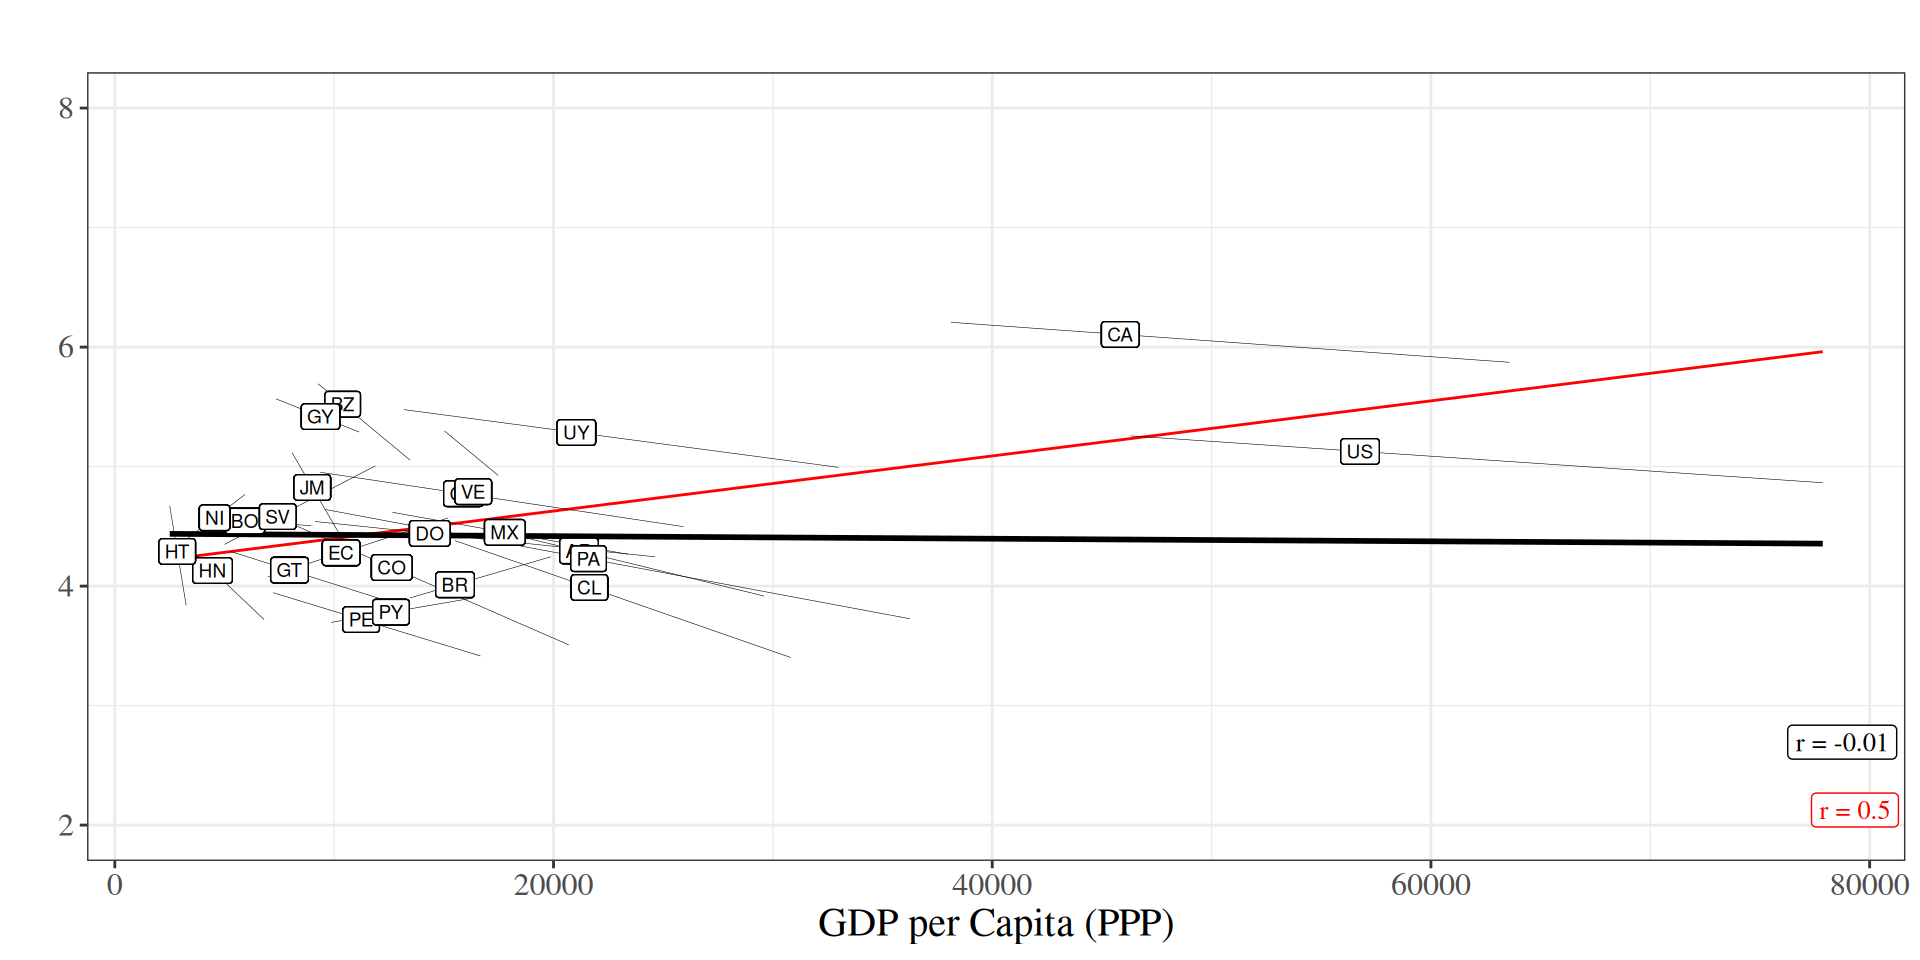
Figura 3: Association between GDP per capita (PPP) and vertical cohesion. Red line represents the association including Canada and United States.
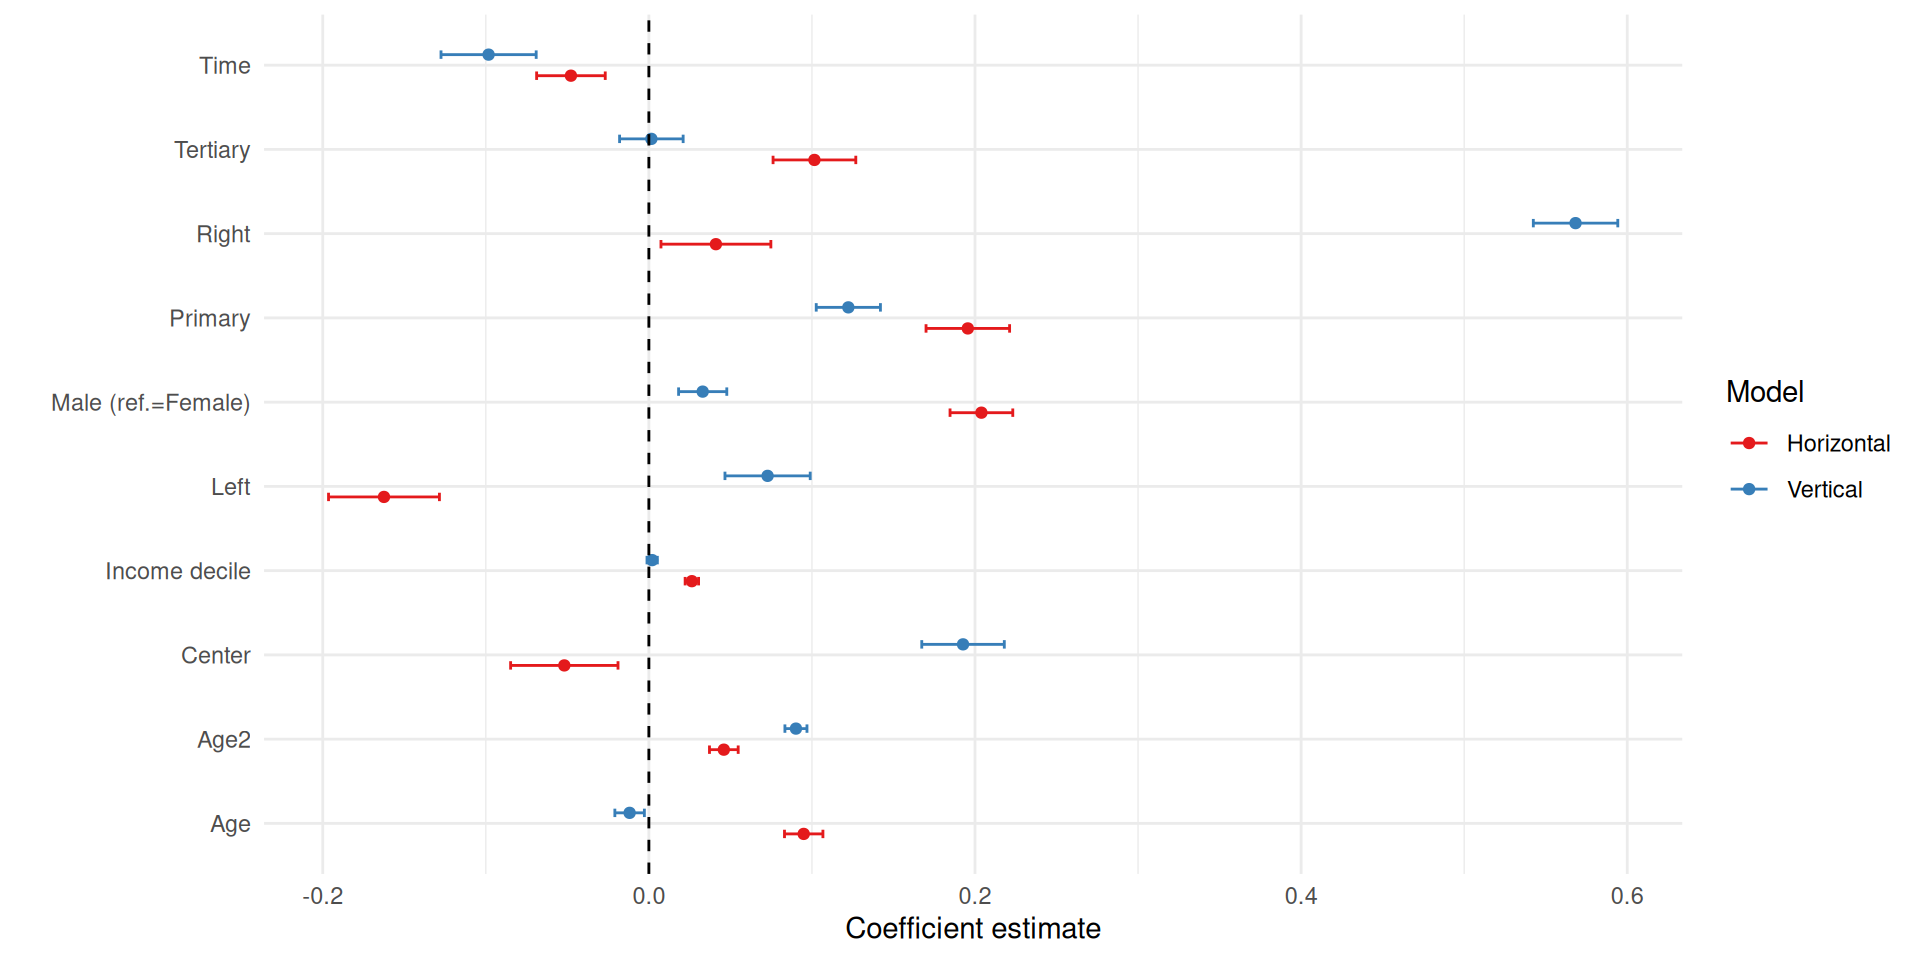
Figura 4: Multilevel regression for individual level factors and social cohesion
| Horizontal | Vertical | |||||
|---|---|---|---|---|---|---|
| Model 1 | Model 2 | Model 3 | Model 4 | Model 5 | Model 6 | |
| Time | -0.086** | -0.094** | -0.105*** | -0.180*** | -0.208*** | -0.214*** |
| (0.031) | (0.031) | (0.030) | (0.040) | (0.038) | (0.038) | |
| Gini (BE) | -1.811 | -1.791 | -1.767 | -3.757* | -3.691* | -3.718* |
| (2.320) | (1.959) | (2.054) | (1.901) | (1.637) | (1.697) | |
| Gini (WE) | -3.401* | -3.538* | -3.503* | -6.648** | -5.916** | -5.876** |
| (1.581) | (1.600) | (1.556) | (2.164) | (2.029) | (2.015) | |
| GDP (BE) | 0.198 | 0.161 | 0.120 | 0.258 | 0.223 | 0.207 |
| (0.176) | (0.189) | (0.229) | (0.149) | (0.165) | (0.194) | |
| GDP (WE) | 0.171 | 0.197 | 0.546 | 0.401 | 0.468 | 0.730* |
| (0.277) | (0.276) | (0.294) | (0.368) | (0.342) | (0.372) | |
| Democracy (BE) | -3.079* | -2.972* | -2.111* | -2.058 | ||
| (1.206) | (1.263) | (1.015) | (1.050) | |||
| Democracy (WE) | -0.830 | -0.631 | -3.792*** | -3.632*** | ||
| (0.599) | (0.586) | (0.762) | (0.762) | |||
| Governace (BE) | 0.995** | 0.973** | 0.756** | 0.744** | ||
| (0.319) | (0.334) | (0.267) | (0.277) | |||
| Governace (WE) | -0.085 | -0.210 | 0.743* | 0.640* | ||
| (0.251) | (0.248) | (0.320) | (0.322) | |||
| Migration (BE) | 0.019 | 0.007 | ||||
| (0.050) | (0.041) | |||||
| Migration (WE) | -0.111** | -0.090 | ||||
| (0.038) | (0.050) | |||||
| AIC | 958631.141 | 958627.080 | 958631.660 | 846342.480 | 846318.283 | 846327.710 |
| BIC | 958815.995 | 958853.013 | 958878.132 | 846527.334 | 846544.215 | 846574.182 |
| Log Likelihood | -479297.571 | -479291.540 | -479291.830 | -423153.240 | -423137.141 | -423139.855 |
| Num. obs. | 213130 | 213130 | 213130 | 213130 | 213130 | 213130 |
| Num. groups: country_wave | 161 | 161 | 161 | 161 | 161 | 161 |
| Num. groups: pais | 22 | 22 | 22 | 22 | 22 | 22 |
| Var: country_wave (Intercept) | 0.091 | 0.090 | 0.085 | 0.178 | 0.151 | 0.149 |
| Var: pais (Intercept) | 0.202 | 0.136 | 0.148 | 0.121 | 0.084 | 0.090 |
| Var: Residual | 5.010 | 5.010 | 5.010 | 2.956 | 2.956 | 2.956 |
| ***p < 0.001; **p < 0.01; *p < 0.05 | ||||||
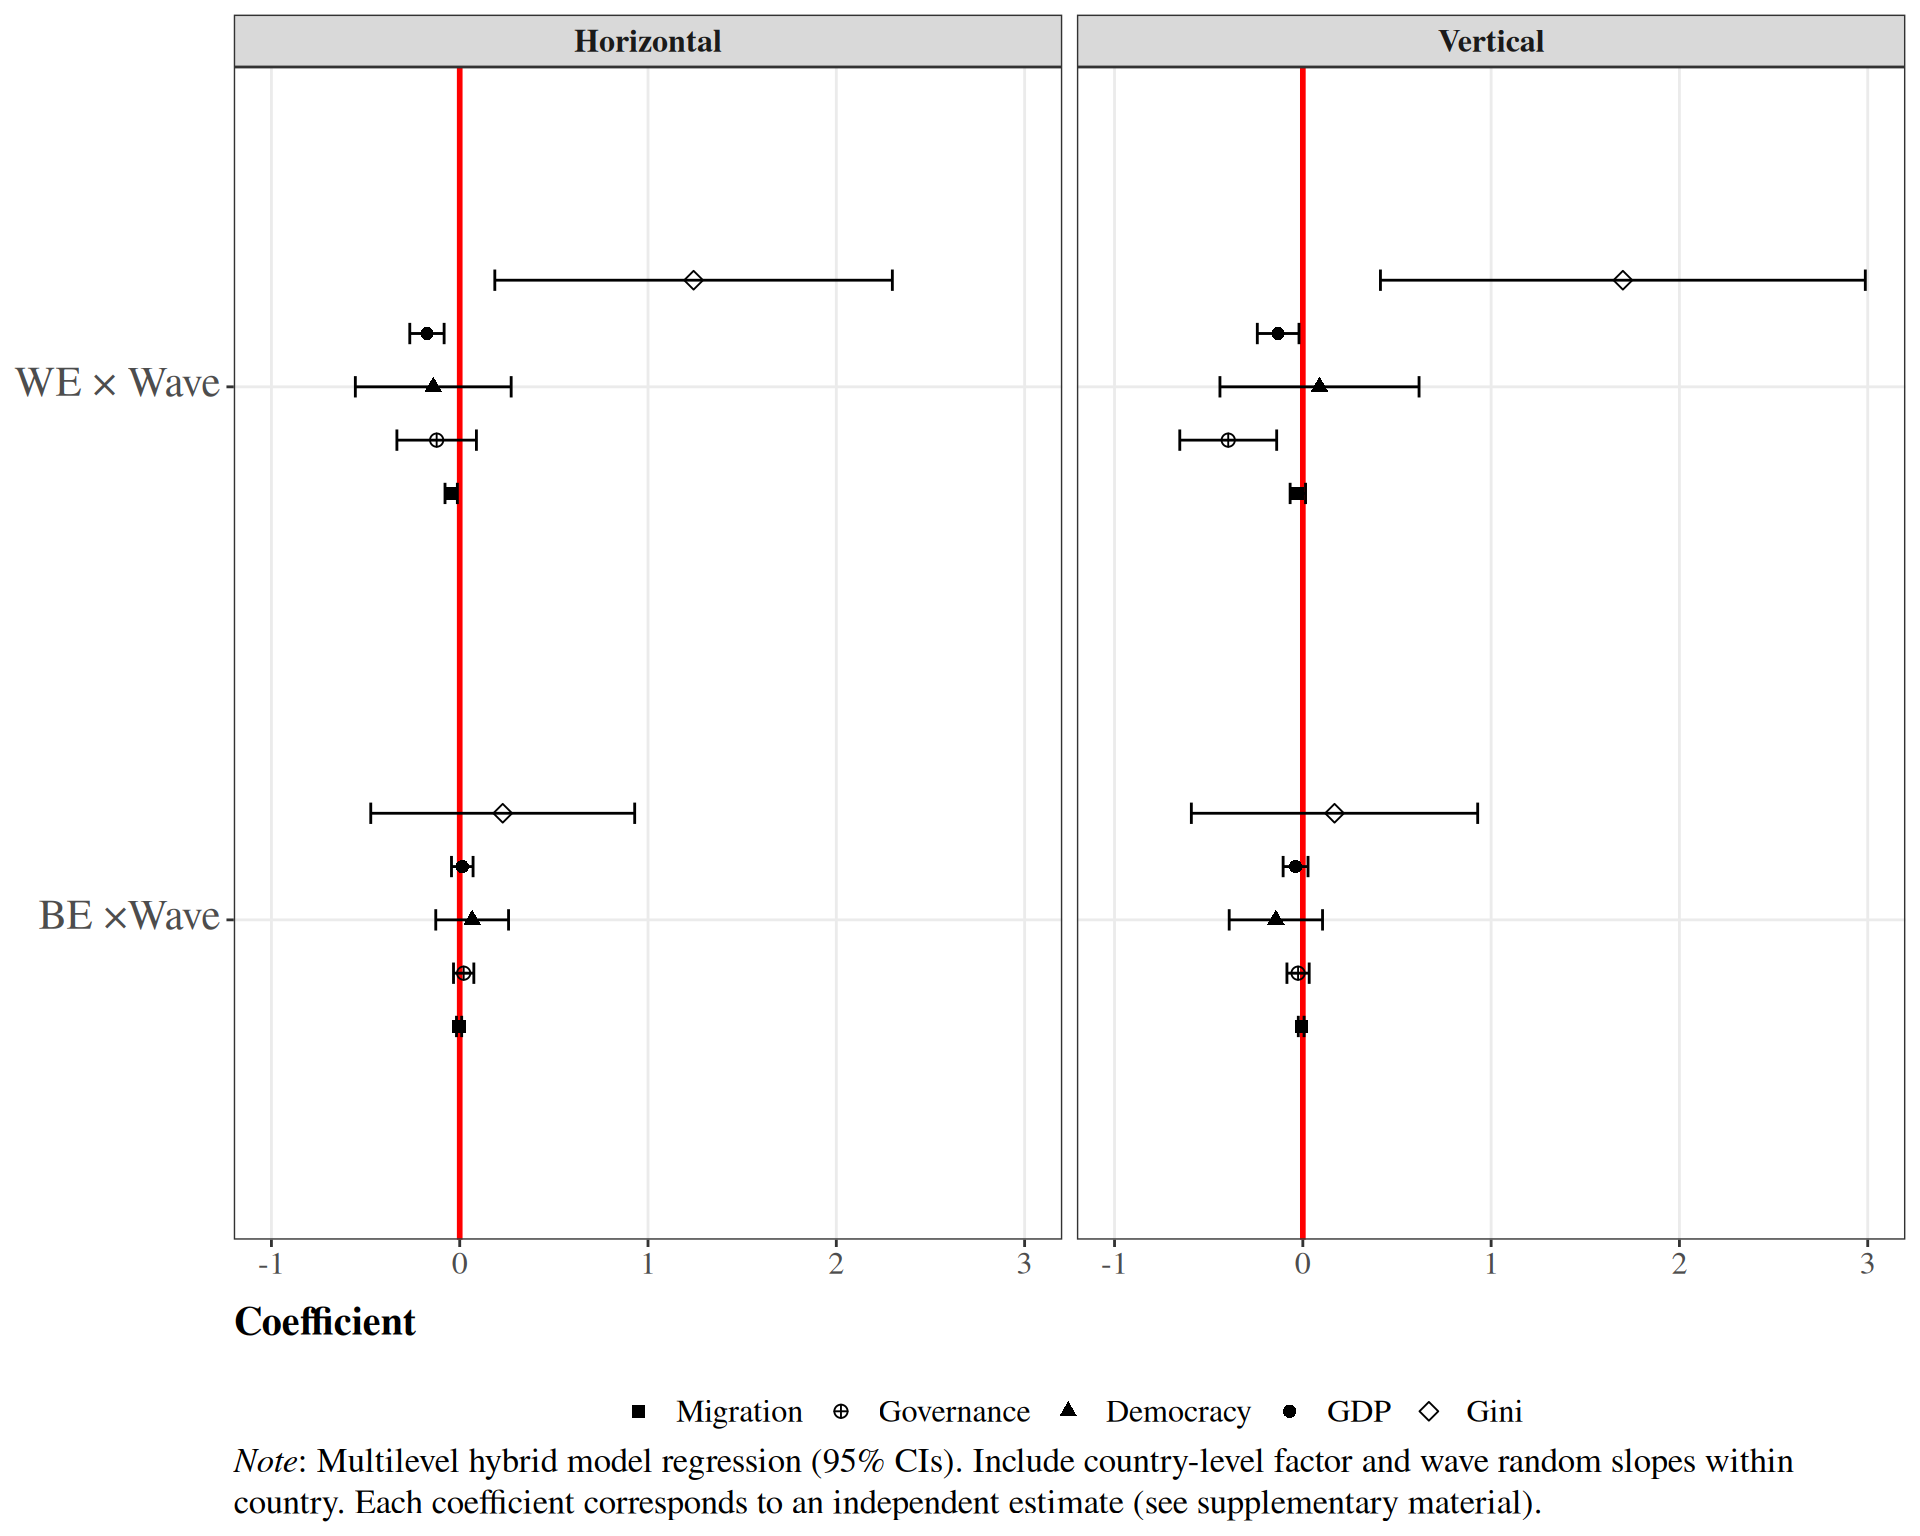
Interactions